Back in August of 2010 I had a website design idea. I worked on the various parts of it but I never wrote much in that booklet and my shallow web programming skills prevented me from understanding what exactly I needed to do.
Almost two and a half years later, I’ve finally cobbled it together.
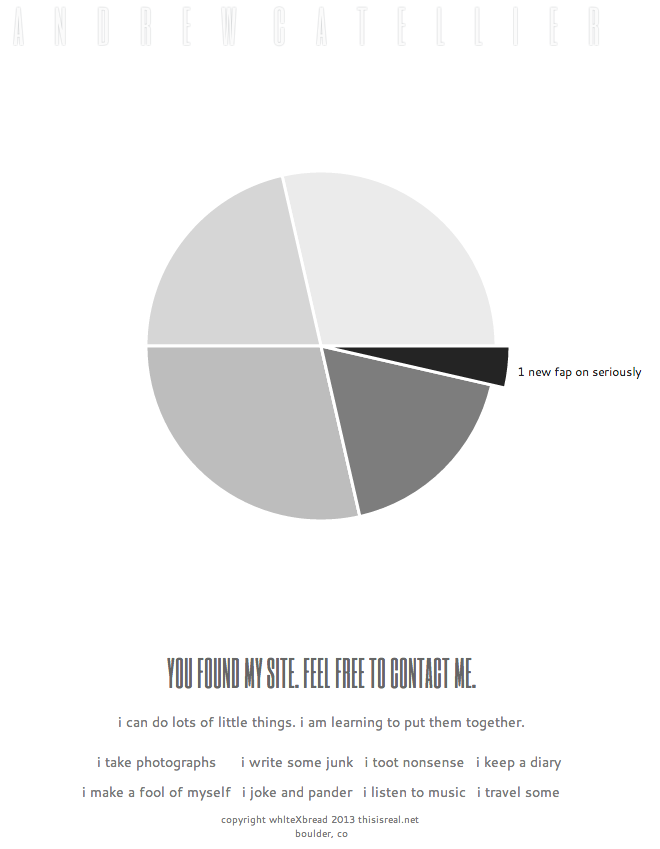
The seeds of the idea were planted when I saw cbowns.com (and if you follow the chain, emerick.org)—how nice is it to be able to point people to all the things you do on the internet? I promptly stole the idea and did something similar with my site. Then, inspired by what I learned about HTML5 (and later encouraged by what Jim Ray said about svgweb), I thought it would be cool to show how much activity occurred recently on any given site using a pie chart.
I know.
This would make it easy, for example, for my family to see if I’ve uploaded the photos from that recent vacation (I haven’t), because that would make the flickr slice of the chart would get larger. Additionally, it reminds me that I haven’t uploaded anything to Vimeo recently, and that I should write more on my blog.
Right now, there’s a php script (configured to run only once daily) that will check the RSS/XML feeds of the various places I live on the tubes (except Twitter, lol). It parses the feeds (using Magpie RSS and an XML parser I lifted from the comments of a php doc page), gathers relevant information, and stores the information for quick retrieval. When the page is loaded, simple JavaScript code reads data in a hidden table and then instructs Raphael.js to draw a pie chart. When I say “cobbled”, I mean “cobbled”.
It feels great to finally get this out of my brain. Adding to my excitement, perhaps foolishly, is that I haven’t seen anything like this. It seems new. It’s not perfect and there are things I’d like to change and add, but this is a start. Done is the engine of more, right?